Pandas - 시각화(visualization) 그래프 그리기 (4-2) - Seaborn
Pandas 시각화 그래프 그리기 (4-2) - Seaborn
Seaborn의 다양한 그래프에 대해 실습해본다.
데이터를 가져와서 그래프를 만드는 코드 순서
- 데이터셋 로드
- set_style() : 테마 설정
- figure() : 그래프 크기 설정
- add_subplot() : 그래프 위치 설정. 여러 개의 그래프를 그릴 때 사용
- 그래트 형태 설정
- 그래프 출력
seaborn 이란
- matplotlib을 기반으로 다양한 색상 테마와 통계용 차트 등의 기능을 추가한 시각화 패키지
- pandas와 함께 사용하기 좋음
- 다양한 통계 차트와 색상 테마를 제공
import warnings
import pandas as pd
#MatPlotLib
import matplotlib.pyplot as plt
from matplotlib import font_manager, rc
import plotly.express as px
import seaborn as sns

"""
seaborn 이란
- matplotlib을 기반으로 다양한 색상 테마와 통계용 차트 등의 기능을 추가한 시각화 패키지
- matplotlib 보다 사용하기 쉬움
- pandas와 함께 사용하기 좋음
- 다양한 통계 차트와 색상 테마를 제공
"""

#경고 메시지 무시
warnings.simplefilter("ignore")

#외부에서 폰트를 불러오는 방법
"""기본 포멧 start"""
fnot_path = "./font_data/malgun.ttf"
font_name = font_manager.FontProperties(fname=fnot_path).get_name()
rc('font', family=font_name)


####################
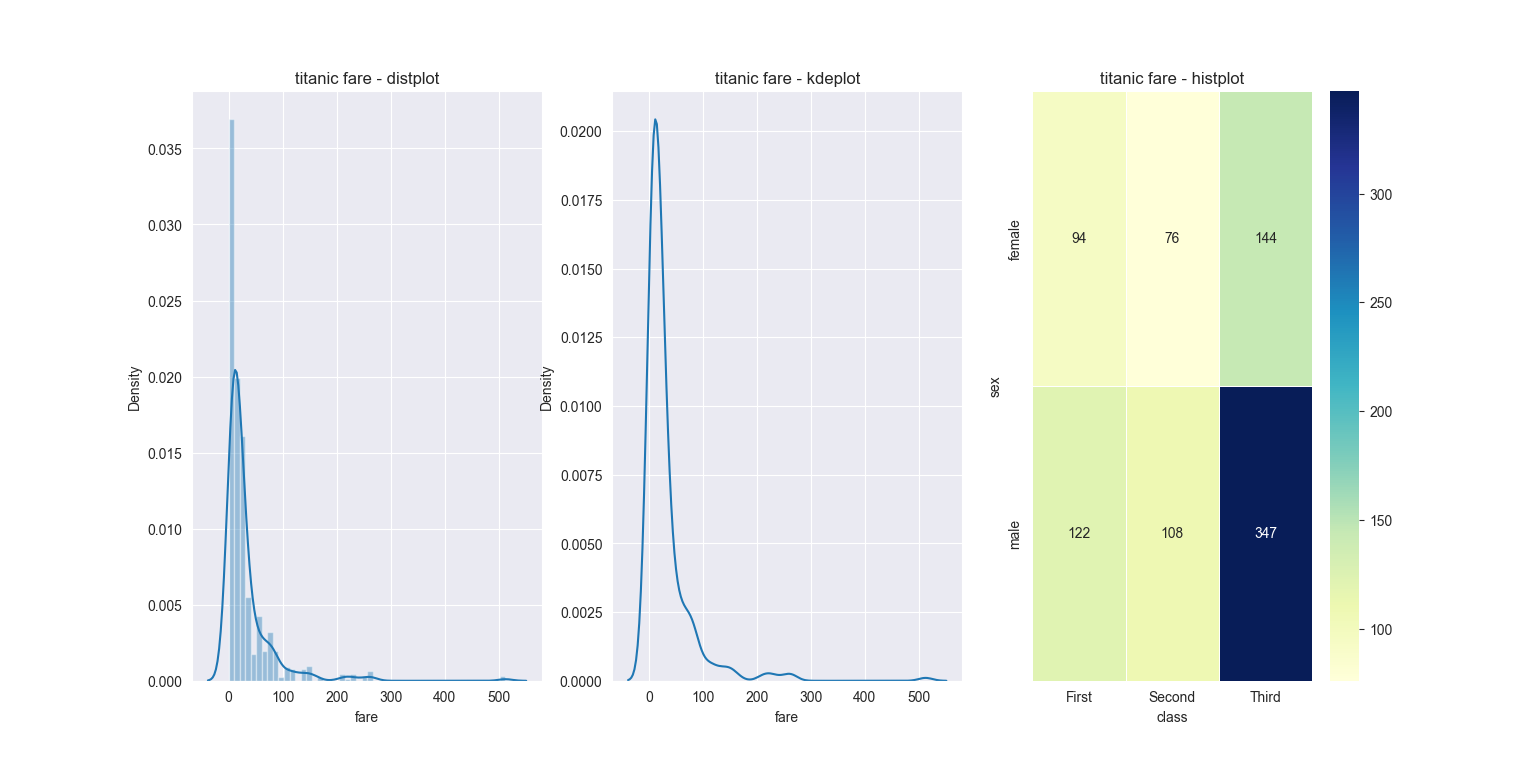
#히스토그램, 밀집도 그래프
titanic = sns.load_dataset('titanic') #seaborn에서 제공하는 데이터셋 load_dataset은 데이터프레임으로 반환
sns.set_style('darkgrid')

fig = plt.figure(figsize=(15, 5)) #그래프 크기 지정
ax1 = fig.add_subplot(1, 3, 1)
ax2 = fig.add_subplot(1, 3, 2)
ax3 = fig.add_subplot(1, 3, 3)

sns.distplot(titanic['fare'], ax=ax1) #히스토그램
sns.kdeplot(titanic['fare'], ax=ax2) #밀집도 그래프
sns.histplot(titanic['fare'], ax=ax3) #히스토그램

ax1.set_title('titanic fare - distplot')
ax2.set_title('titanic fare - kdeplot')
ax3.set_title('titanic fare - histplot')

####################
#피벗테이블로 범주형 변수를 각각 행, 열로 재구분하여 정리
#pivot_table
#피벗테이블이란 : 데이터 열 중에서 두 개의 열을 각각 행 인덱스, 열 인덱스로 사용하여 데이터를 조회하여 펼쳐놓은 것
titanic = sns.load_dataset('titanic') #seaborn에서 제공하는 데이터셋 load_dataset은 데이터프레임으로 반환
sns.set_style('darkgrid')

table = titanic.pivot_table(index=['sex'], columns=['class'], aggfunc='size')
print(table)

sns.heatmap(table,                  # 데이터프레임
            annot=True, fmt='d',    # 데이터 값 표시 여부, 정수형 포맷
            cmap='YlGnBu',          # 컬러 맵
            linewidth=.5,           # 구분 선
            cbar=True)             # 컬러 바 표시 여부
#plt.show()

##########
# 이산형 변수의 분포 만들기
#stripplot, swarmplot
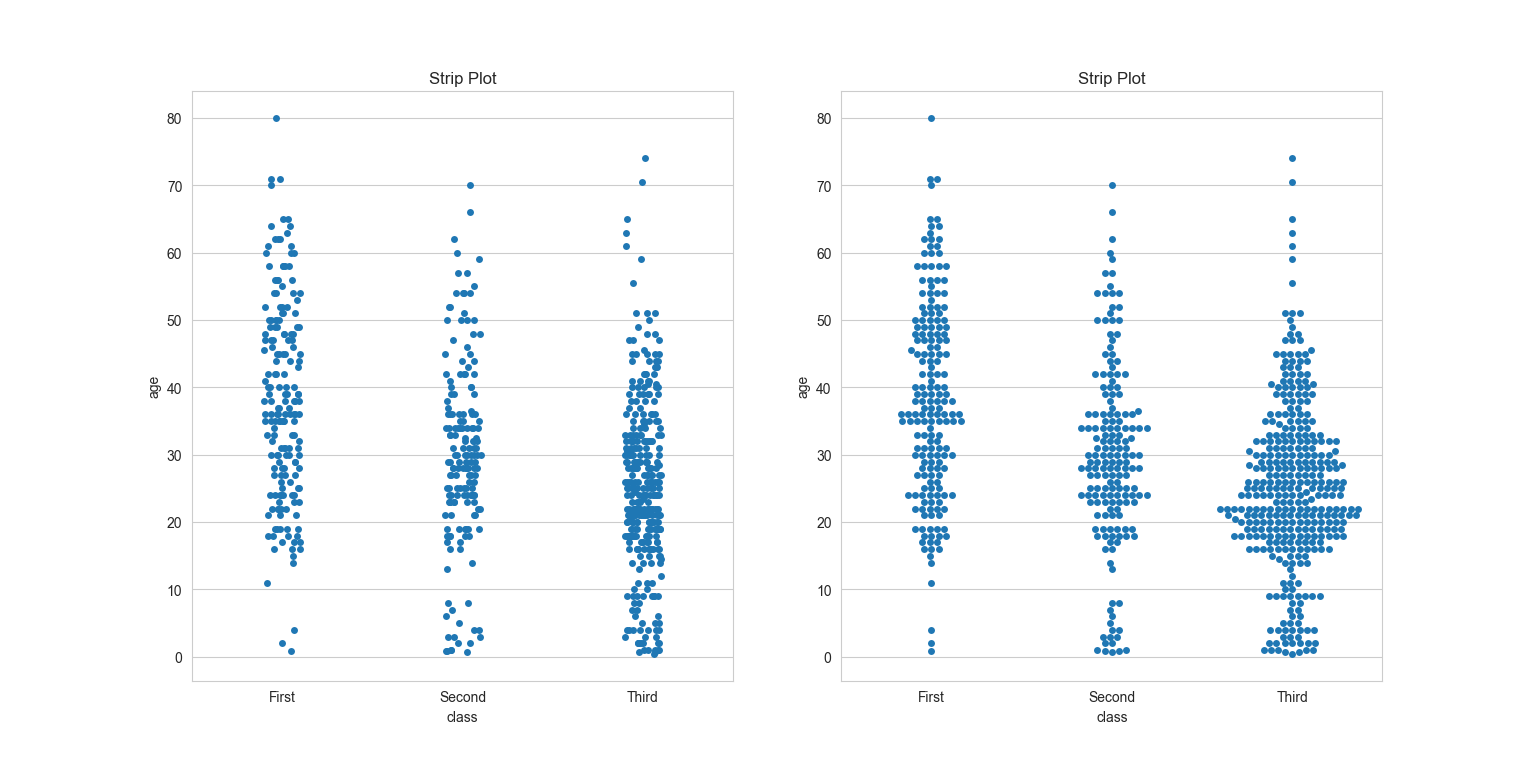
#stripplot : 데이터 분산 미고려
#swarmplot : 데이터 분산 고려 (중복 X)
titanic = sns.load_dataset('titanic') #seaborn에서 제공하는 데이터셋 load_dataset은 데이터프레임으로 반환
sns.set_style('whitegrid')

fig = plt.figure(figsize=(15, 5)) #그래프 크기 지정
ax1 = fig.add_subplot(1, 2, 1)
ax2 = fig.add_subplot(1, 2, 2)

#이산형 변수의 분포 - 데이터 분산 미고려
sns.stripplot(x='class', y='age', data=titanic, ax=ax1) #x축 : class, y축 : age, 데이터 : titanic, ax : 그래프를 그릴 위치

#이산형 변수의 분포 - 데이터 분산 고려 (중복 X)
sns.swarmplot(x='class', y='age', data=titanic, ax=ax2) #x축 : class, y축 : age, 데이터 : titanic, ax : 그래프를 그릴 위치

ax1.set_title('Strip Plot')
ax2.set_title('Strip Plot')

#plt.show()

##########
#막대 그래프 - barplot
titanic = sns.load_dataset('titanic') #seaborn에서 제공하는 데이터셋 load_dataset은 데이터프레임으로 반환
sns.set_style('whitegrid')

fig = plt.figure(figsize=(15, 5)) #그래프 크기 지정
ax1 = fig.add_subplot(1, 3, 1)
ax2 = fig.add_subplot(1, 3, 2)
ax3 = fig.add_subplot(1, 3, 3)

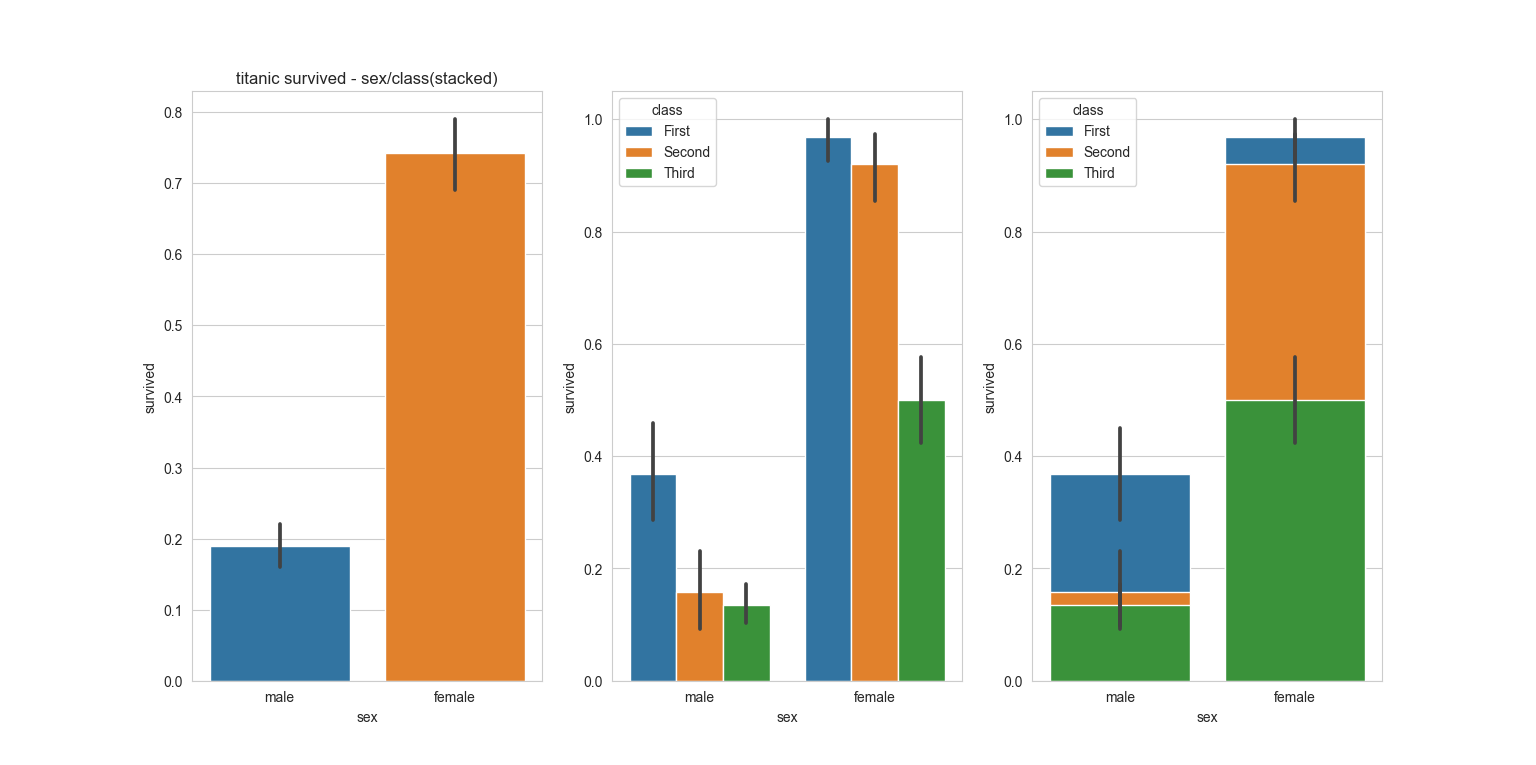
sns.barplot(x='sex', y='survived', data=titanic, ax=ax1)
sns.barplot(x='sex', y='survived', hue='class', data=titanic, ax=ax2)
sns.barplot(x='sex', y='survived', hue='class', dodge=False, data=titanic, ax=ax3)

#차트 제목 표시
ax1.set_title('titanic survived - sex')
ax1.set_title('titanic survived - sex/class')
ax1.set_title('titanic survived - sex/class(stacked)')

#plt.show()

##########
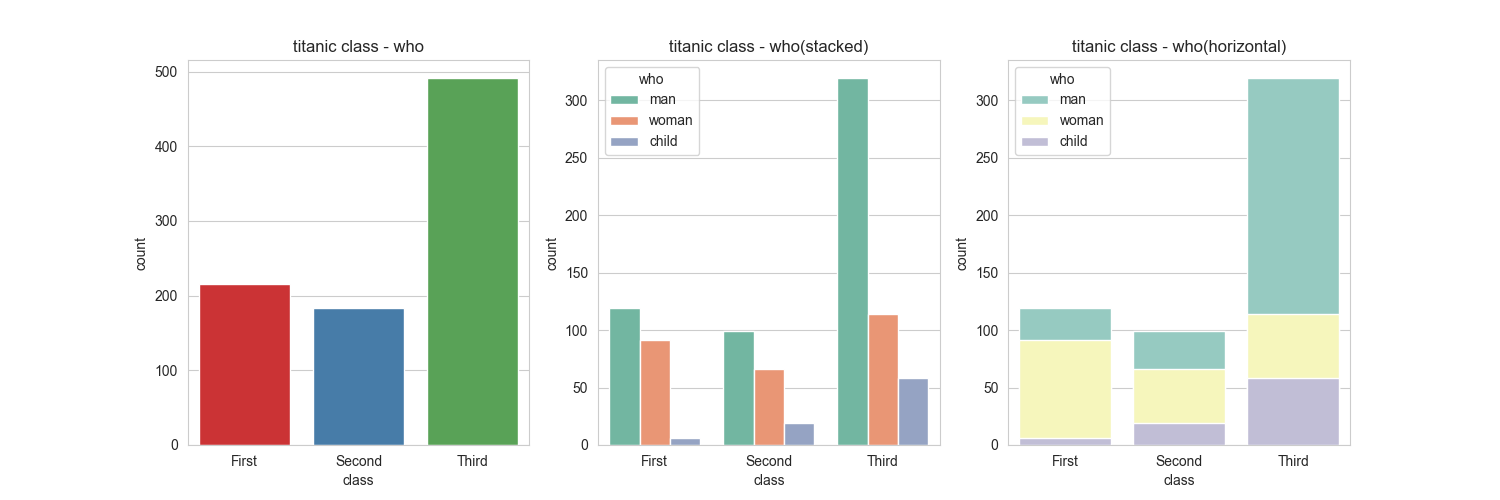
#countplot : 각 카테고리 값별로 데이터 빈도를 표시하는 차트
titanic = sns.load_dataset('titanic') #seaborn에서 제공하는 데이터셋 load_dataset은 데이터프레임으로 반환
sns.set_style('whitegrid')

fig = plt.figure(figsize=(15, 5)) #그래프 크기 지정
ax1 = fig.add_subplot(1, 3, 1)
ax2 = fig.add_subplot(1, 3, 2)
ax3 = fig.add_subplot(1, 3, 3)

sns.countplot(x='class', hue='who', palette='Set2', data=titanic, ax=ax2)
sns.countplot(x='class', palette='Set1', data=titanic, ax=ax1)
sns.countplot(x='class', hue='who', palette='Set3', dodge=False, data=titanic, ax=ax3)

ax1.set_title('titanic class - who')
ax2.set_title('titanic class - who(stacked)')
ax3.set_title('titanic class - who(horizontal)')

#plt.show()


######
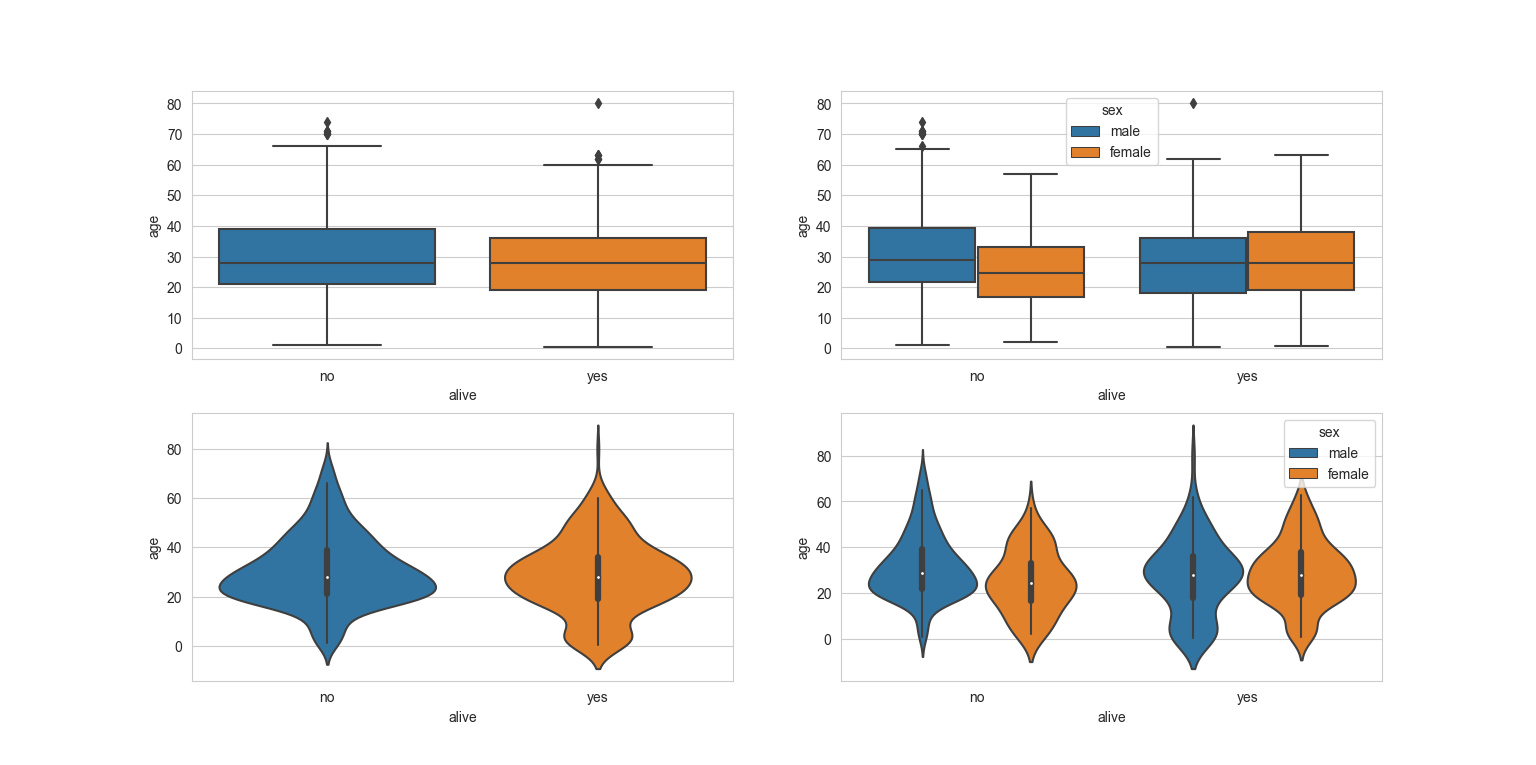
# 박스 플롯/바이올린 그래프 - boxplot, violinplot
# 박스 플롯 : 정해진 여러 값들의 데이터 분포를 시각화
# 바이올린 그래프 : 박스 플롯 + 커널 밀도 히스토그램
titanic = sns.load_dataset('titanic') #seaborn에서 제공하는 데이터셋 load_dataset은 데이터프레임으로 반환
sns.set_style('whitegrid')

fig = plt.figure(figsize=(15, 10)) #그래프 크기 지정
ax1 = fig.add_subplot(2, 2, 1)
ax2 = fig.add_subplot(2, 2, 2)
ax3 = fig.add_subplot(2, 2, 3)
ax4 = fig.add_subplot(2, 2, 4)

sns.boxplot(x='alive', y='age', data=titanic, ax=ax1) #ax : 그래프를 그릴 위치
sns.boxplot(x='alive', y='age', hue='sex', data=titanic, ax=ax2) #hue : 그룹별로 나누는 기준
sns.violinplot(x='alive', y='age', data=titanic, ax=ax3)
sns.violinplot(x='alive', y='age', hue='sex', data=titanic, ax=ax4)

plt.show()

댓글남기기