Pandas - 시각화(visualization) 그래프 그리기(4-1) Seaborn
Pandas 시각화 그래프 그리기(4-1) - Seaborn
이 실습 코드에서는 Seaborn에 대해 알아본다.
seaborn 이란
- matplotlib을 기반으로 다양한 색상 테마와 통계용 차트 등의 기능을 추가한 시각화 패키지
- pandas와 함께 사용하기 좋음
- 다양한 통계 차트와 색상 테마를 제공
import warnings
import pandas as pd
#MatPlotLib
import matplotlib.pyplot as plt
from matplotlib import font_manager, rc
import plotly.express as px
import seaborn as sns

#경고 메시지 무시
warnings.simplefilter("ignore")

#외부에서 폰트를 불러오는 방법
"""기본 포멧 start"""
fnot_path = "./font_data/malgun.ttf"
font_name = font_manager.FontProperties(fname=fnot_path).get_name()
rc('font', family=font_name)

titanic = sns.load_dataset('titanic') #seaborn에서 제공하는 데이터셋 load_dataset은 데이터프레임으로 반환
print(titanic.head())
print("\n")
print(titanic.info())

# 스타일 테마 설정 (5가지 : darkgrid, whitegrid, dark, white, ticks)
sns.set_style('darkgrid')
fig = plt.figure(figsize=(15, 5)) #그래프 크기 지정
ax1 = fig.add_subplot(1, 2, 1) #1행 2열의 1번째 그래프
ax2 = fig.add_subplot(1, 2, 2) #1행 2열의 2번째 그래프


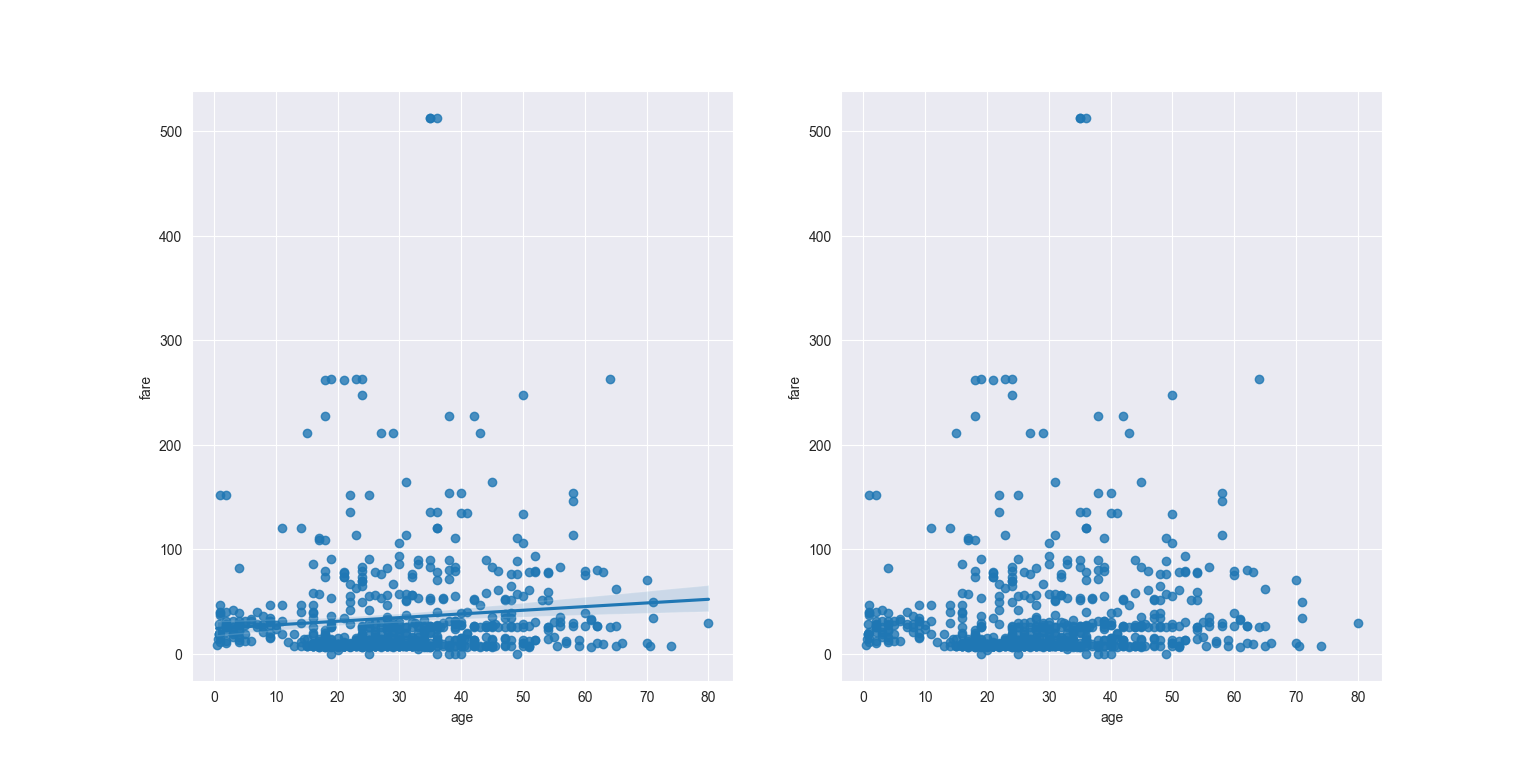
# 선형회귀선이란 : 데이터의 흐름을 가장 잘 나타내는 직선을 그리는 것
#그래프 그리기 = 선형회귀선 표시(fig_reg = True), fig_reg 없으면 기본값은 True
sns.regplot(x='age', y='fare', data=titanic, ax=ax1) #회귀선 표시
# 그래프 그리기 = 선형회귀선 미표시(fig_reg = False)
sns.regplot(x='age', y='fare', data=titanic, ax=ax2, fit_reg=False) #회귀선 미표시

plt.show() #그래프를 보여주는 것


댓글남기기